
Tracking Unemployment in New Jersey’s 21 Counties
Although the 3.9% statewide unemployment rate in New Jersey sits roughly where it was prior to the COVID-19 pandemic, unemployment in the Garden State has steadily increased over the past 12 months. From July 2022 to July 2023, the state’s unemployment rate has risen by 0.7 percentage points, surpassing the 3.5% national average, and has gone from the 23rd best in the nation to 7th worst.
While the state’s overall unemployment rate is a key indicator of economic conditions, county-level figures can help us to understand how different parts of the state are affected.
Unemployment figures are not seasonally adjusted at the county level by the US Bureau of Labor Statistics. Seasonal adjustment is a statistical method which eliminates changes due to normal seasonal variation (such as increases in hiring during the summer or holiday season). This means that monthly fluctuations in county data are more pronounced and month-to-month comparisons are less accurate. However, comparisons to the same month in a previous year help to highlight changing dynamics.
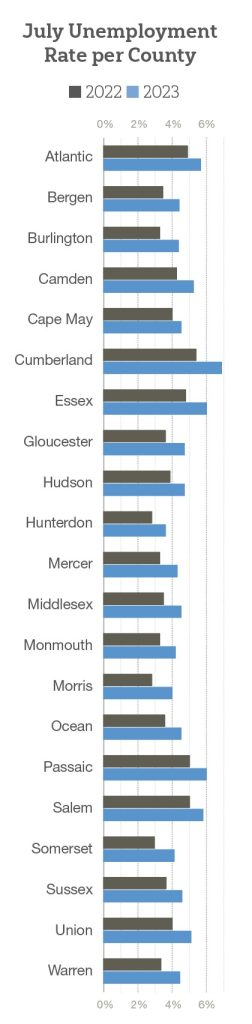
Unemployment at the county level, as of July 2023 – the most recent data available as of this writing – ranged from 3.7% in Hunterdon County to 6.9% in Cumberland County. Over the past 12 months, each of the state’s 21 counties has experienced an increase in the unemployment rate, a trend which aligns with the general increase in unemployment on a statewide basis over the past year.
The largest change has occurred in Cumberland County, which already had the highest unemployment rate in the state in July 2022 (5.3%). Over the past 12 months, unemployment there has increased 1.6 percentage points to 6.9%.
Outside of Cumberland, 11 other counties have experienced increases of at least 1 percentage point year over year: Essex County (+1.2), Burlington County (+1.1), Middlesex County (+1.1), Morris County (+1.1), Somerset County (+1.1), Union County (+1.1), Warren County (+1.1), Camden County (+1.0), Gloucester County (+1.0), Mercer County (+1.0), and Passaic County (+1.0).
The remaining nine counties each had year-over-year changes of less than 1 percentage point, though many arrived barely under that threshold: Hunterdon County (+0.9), Monmouth County (+0.9), Ocean County (+0.9), Sussex County (+0.9), Atlantic County (+0.8), Bergen County (+0.8), Hudson County (+0.8), Salem County (+0.8), and Cape May County (+0.5).
This content was published in the October 2023 Edition of the NJ Business Magazine.
Download PDF